
Nexus — Business Intelligence & Analytics
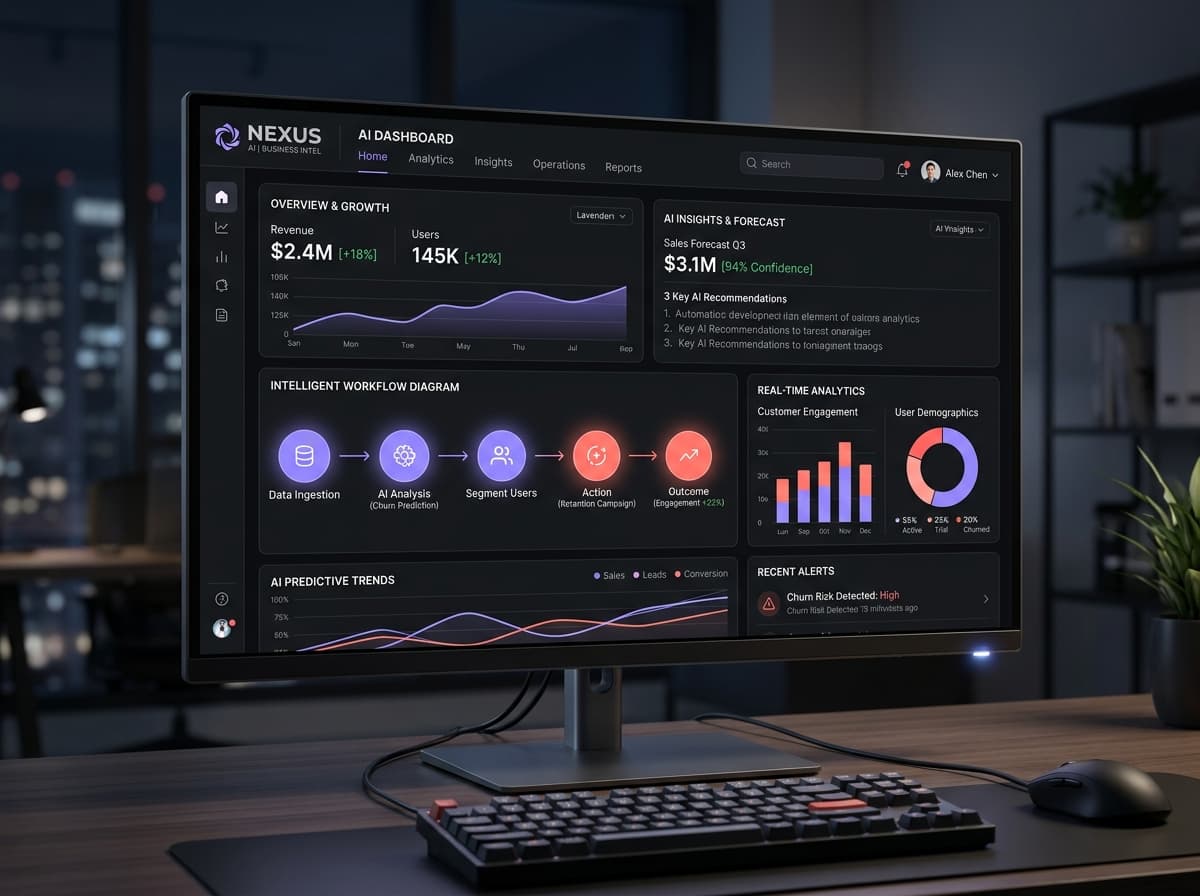
An enterprise operational dashboard unifying multi-source telemetry and actionable insights.
Challenge
Enterprise teams frequently experience dashboard fatigue—cluttered screens filled with disjointed graphs that require cognitive overhead to interpret during daily standups and strategy reviews.
Strategy
We adopted an alert-first strategy: surface anomalous indicators and key business drivers first, allowing executives to inspect deep metrics only when contextual thresholds are crossed.
Design
High-contrast visual hierarchy with custom SVG charts, refined typography, and purposeful status color coding (green for stable, lavender for system triggers, coral for critical interventions).
Development
Engineered utilizing modular component boundaries and high-efficiency CSS variables. Employs lightweight client components only where chart interactivity is strictly necessary.
Outcome
A production-grade interface blueprint showcasing how complex operational metrics can be rendered with speed, elegance, and immediate executive decision-making clarity.
Engineering Benchmarks
- Structured component architecture supporting complex telemetry widgets
- Clean accessibility scoring with high-contrast color pairings
- Zero external heavy chart runtime overhead
Project Visual Artifacts & Gallery
Screens, component specifications, and user experience layouts from Nexus — Business Intelligence & Analytics.

Project Specifications
- • UI/UX Design
- • Dashboard Architecture
- • Data Visualization
- • Component Library
Explore More Case Studies
Browse other architectural studies and engineering systems built by Aaroh.
NexaFlow — Modern SaaS Platform
A high-performance conversion platform designed for a technical B2B software launch.

Aris & Co. — D2C Premium Fashion Experience
An editorial digital flagship store designed for high-end direct-to-consumer lifestyle brands.